A 10-Year Backtest of My Live Trading Portfolio
I ran a 10-year, 100%-modelling-quality backtest of the exact four strategies I trade live — then compared it to two years of Myfxbook-verified results. The honest picture, drawdowns included.
By René Balke
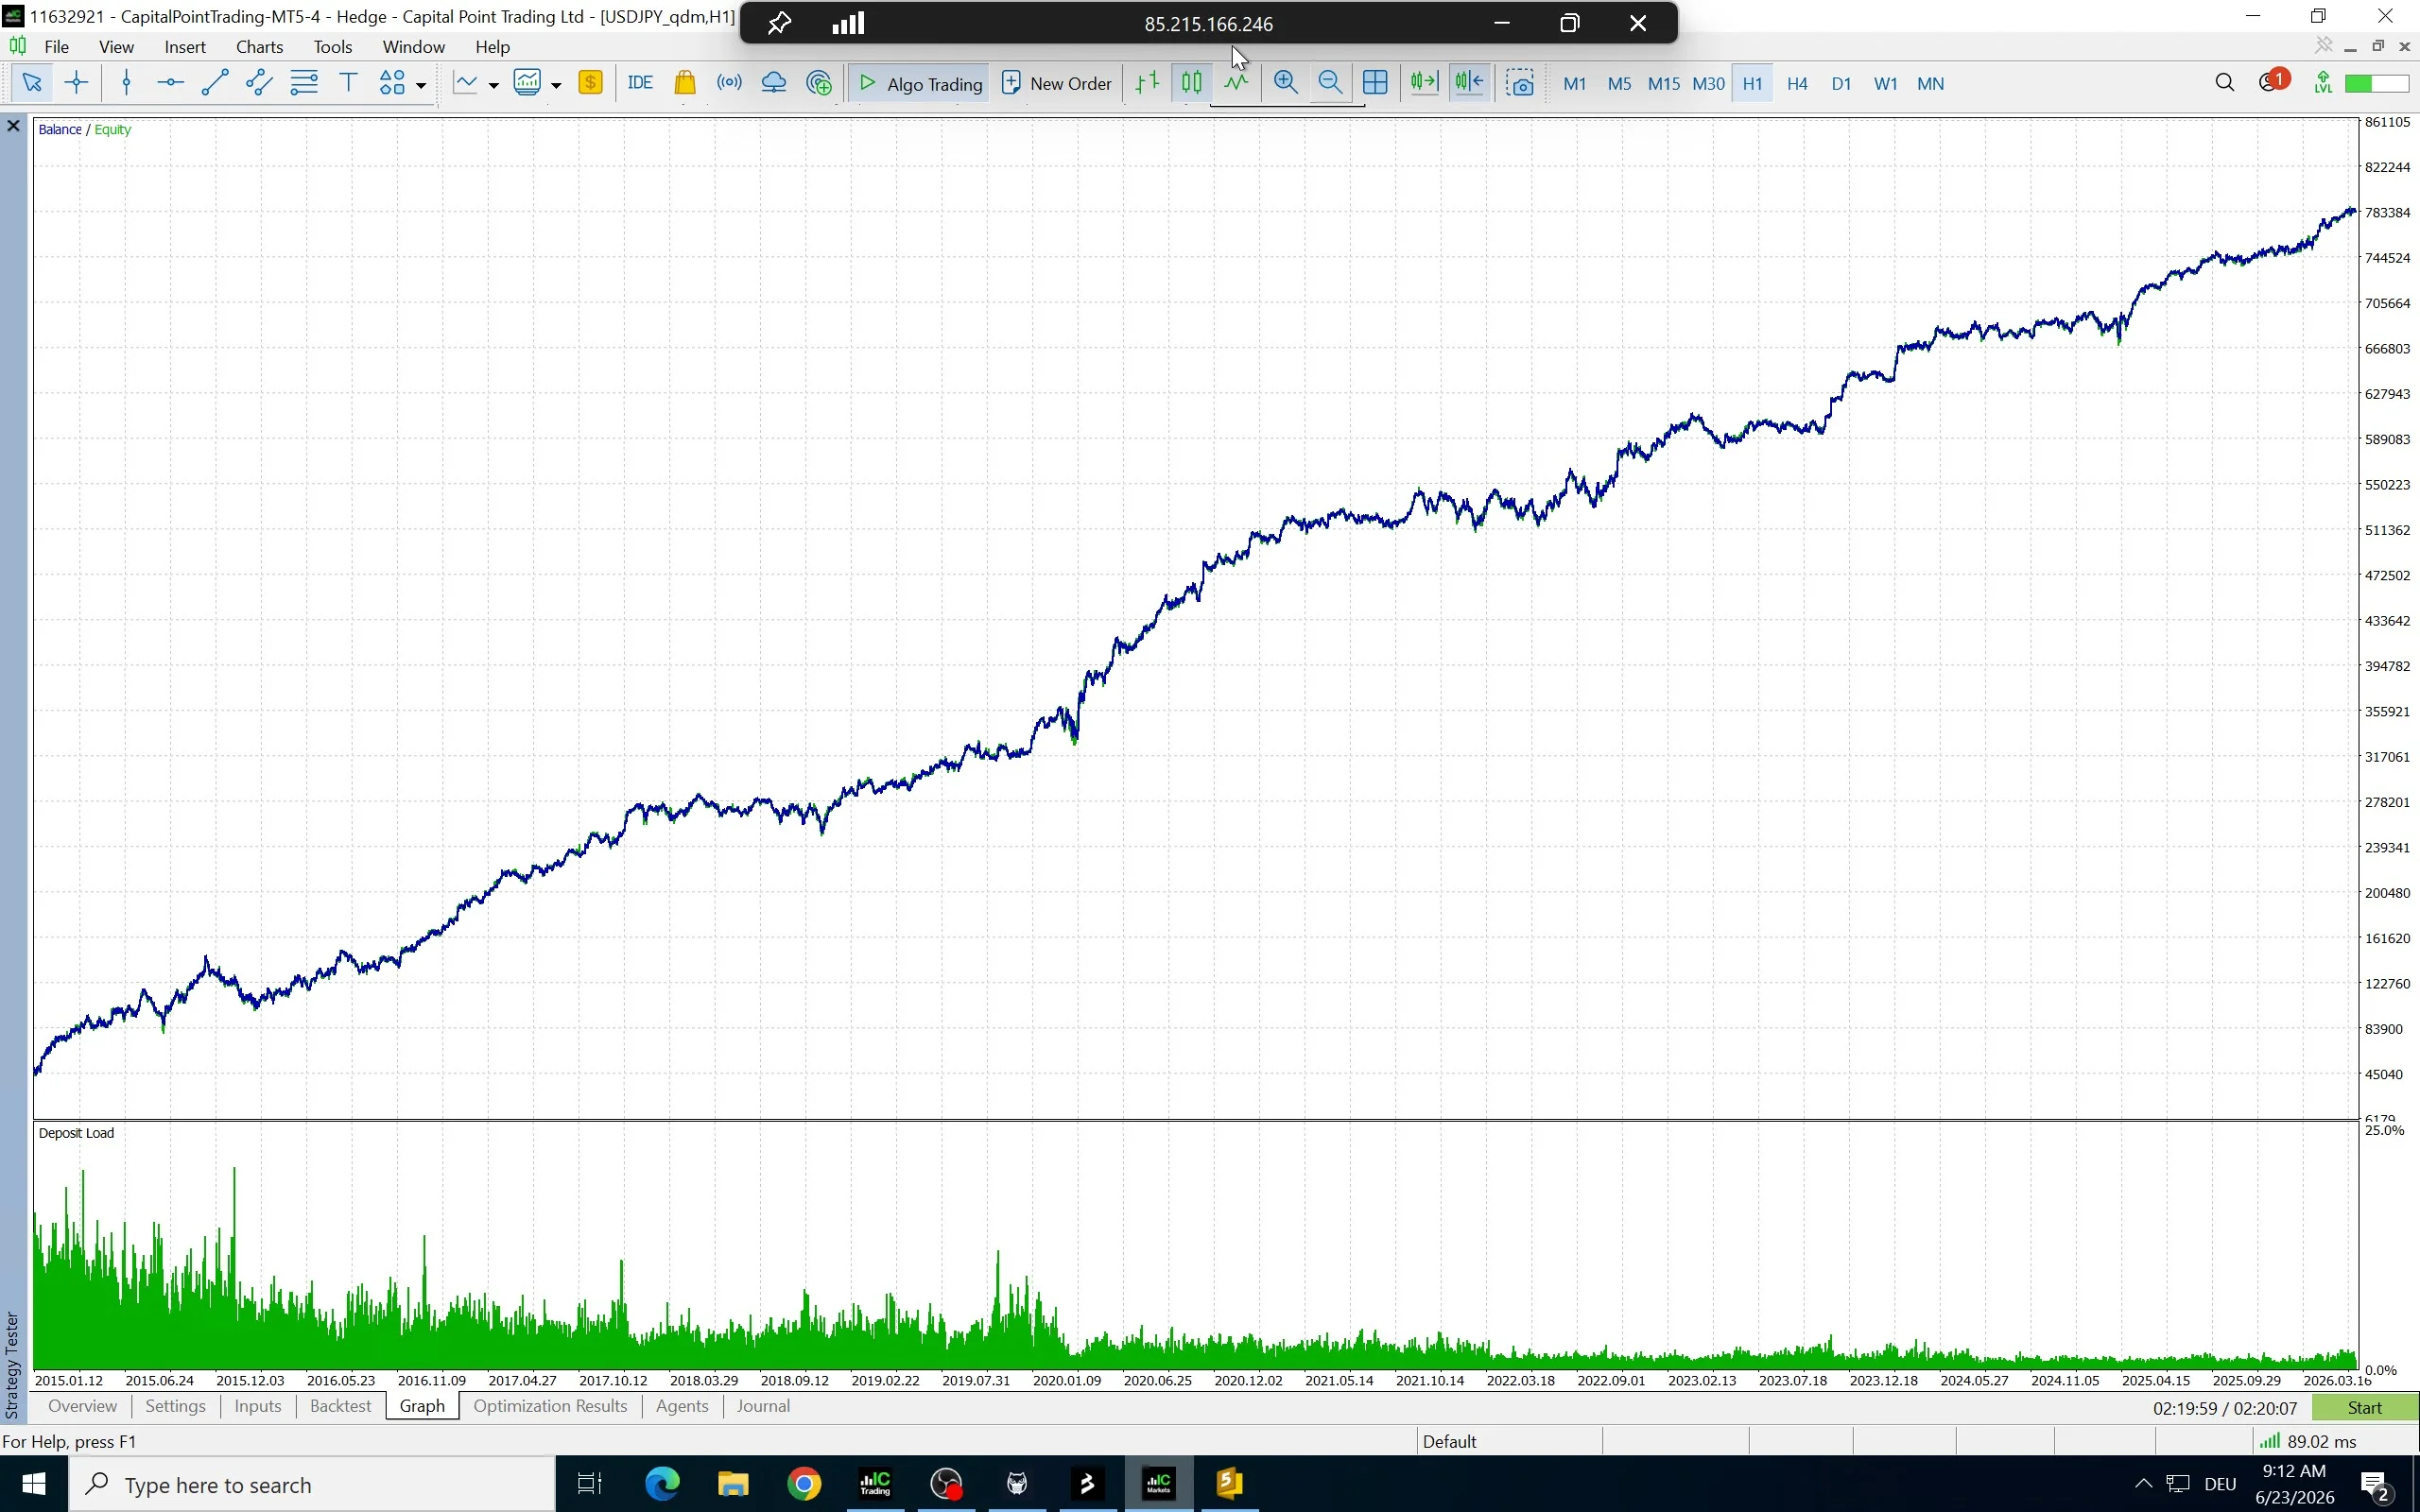
I finally ran a backtest I’ve wanted to do for a long time: a 10-year, 100% modelling-quality test of the exact four strategies I trade in my live account — same EAs, same settings, same risk.
The headline number is large, and I’ll show it. But that’s not really the point of this post. The point is everything underneath it: how the test was built, which markets actually carried it, and — most importantly — how it holds up against two years of real, Myfxbook-verified live trading, including the parts that didn’t go to plan.
No guru screenshots here. Everything below is either a transparent backtest or a verified live result.
Read that backtest number as what it is: a simulation of the past, not a forecast. Real, future results will include losing months and years — and deeper drawdowns than I’ve personally faced so far. I’ll come back to exactly why below.
Watch the full breakdown
The complete walkthrough — how I built the test, the analysis, and the live comparison:
The four strategies in this portfolio
A quick word on each — because the test is only as interesting as the strategies inside it. They’re all deliberately simple, and I genuinely think that simplicity is a big part of why they’ve held up. Each one has its own full tutorial and free download on the site.
Go Long — long-only on index CFDs
Go Long does exactly what the name says: it only opens long positions. I run it on index CFDs because indices tend to grind toward new highs over time — economies grow, and so do the big indices. You set the opening and closing times, TP/SL levels, and can restrict entries to a fresh daily high. It’s a systematic bet on long-term growth — no guarantee it keeps working, but a valid, transparent approach. → Go Long EA
Turnaround Tuesday — riding the early-week recovery
The classic idea: wait for a pullback in the major indices, then ride the recovery move at the start of a new week. It only opens buy trades, and I run it on index CFDs for the same long-term-drift reason as Go Long. Opening/closing day and time, TP/SL, and a fresh-daily-high filter are all configurable. → Turnaround Tuesday EA
Range Breakout — trading the morning range
One of my long-time favourites. You pick two times of day; the EA marks the high and low of that window and places pending orders to trade the breakout in either direction. It comes with a full trade-management toolkit — trailing stops, partial closes, time-based exits. On gold and EURJPY it’s been my steadiest performer. → Range Breakout EA
ATR Candle Breakout — catching momentum candles
This one scans every closed candle and compares its size to the Average True Range. When a candle is much larger than the recent average and closes near its own extreme, the EA reads it as a genuine momentum breakout and trades in that direction — with optional trend, multi-timeframe and support/resistance filters on top. It’s the newest addition to my live account. → ATR Candle Breakout EA
How I built the test
All four strategies run inside a single portfolio EA — one expert advisor managing every strategy across every chart, exactly like in my live account. For the backtest I pointed it at Dukascopy data from 2015 onward, at 100% modelling quality.
A point I want to make clearly, because people always ask: costs are included. The test deducted roughly €200,000 in commissions and swaps over the period — and that’s before spreads. This isn’t a frictionless, fantasy simulation; it pays the same costs a real account would.
The risk is the real thing too: across the entire test I used the same risk and settings I use live — around €500 per trade, which on the account is a conservative ~1%.
Which markets carried it — and which hurt
Here’s where a portfolio view earns its keep. The results were not evenly spread:
- Indices (DE40, US30, US Tech) were the big winners, via Go Long and Turnaround Tuesday. But be honest about why: markets pushed to new highs for years. When that stops — and one day it will — those same positions will hurt.
- Gold was one of the steadiest lines in the whole test (Range Breakout), and I’ve been trading it live since around 2024.
- USDJPY is in its biggest drawdown since 2015 with these settings — and yes, I’m holding it live, riding the whole thing down. It’s one of my worst performers right now.
- GBPUSD: last year was its worst year in the entire test. A good reminder that “trade this pair” can look obvious in hindsight and painful in real time.
- The currency range-breakout pairs go through long, ugly drawdown phases between their good runs.
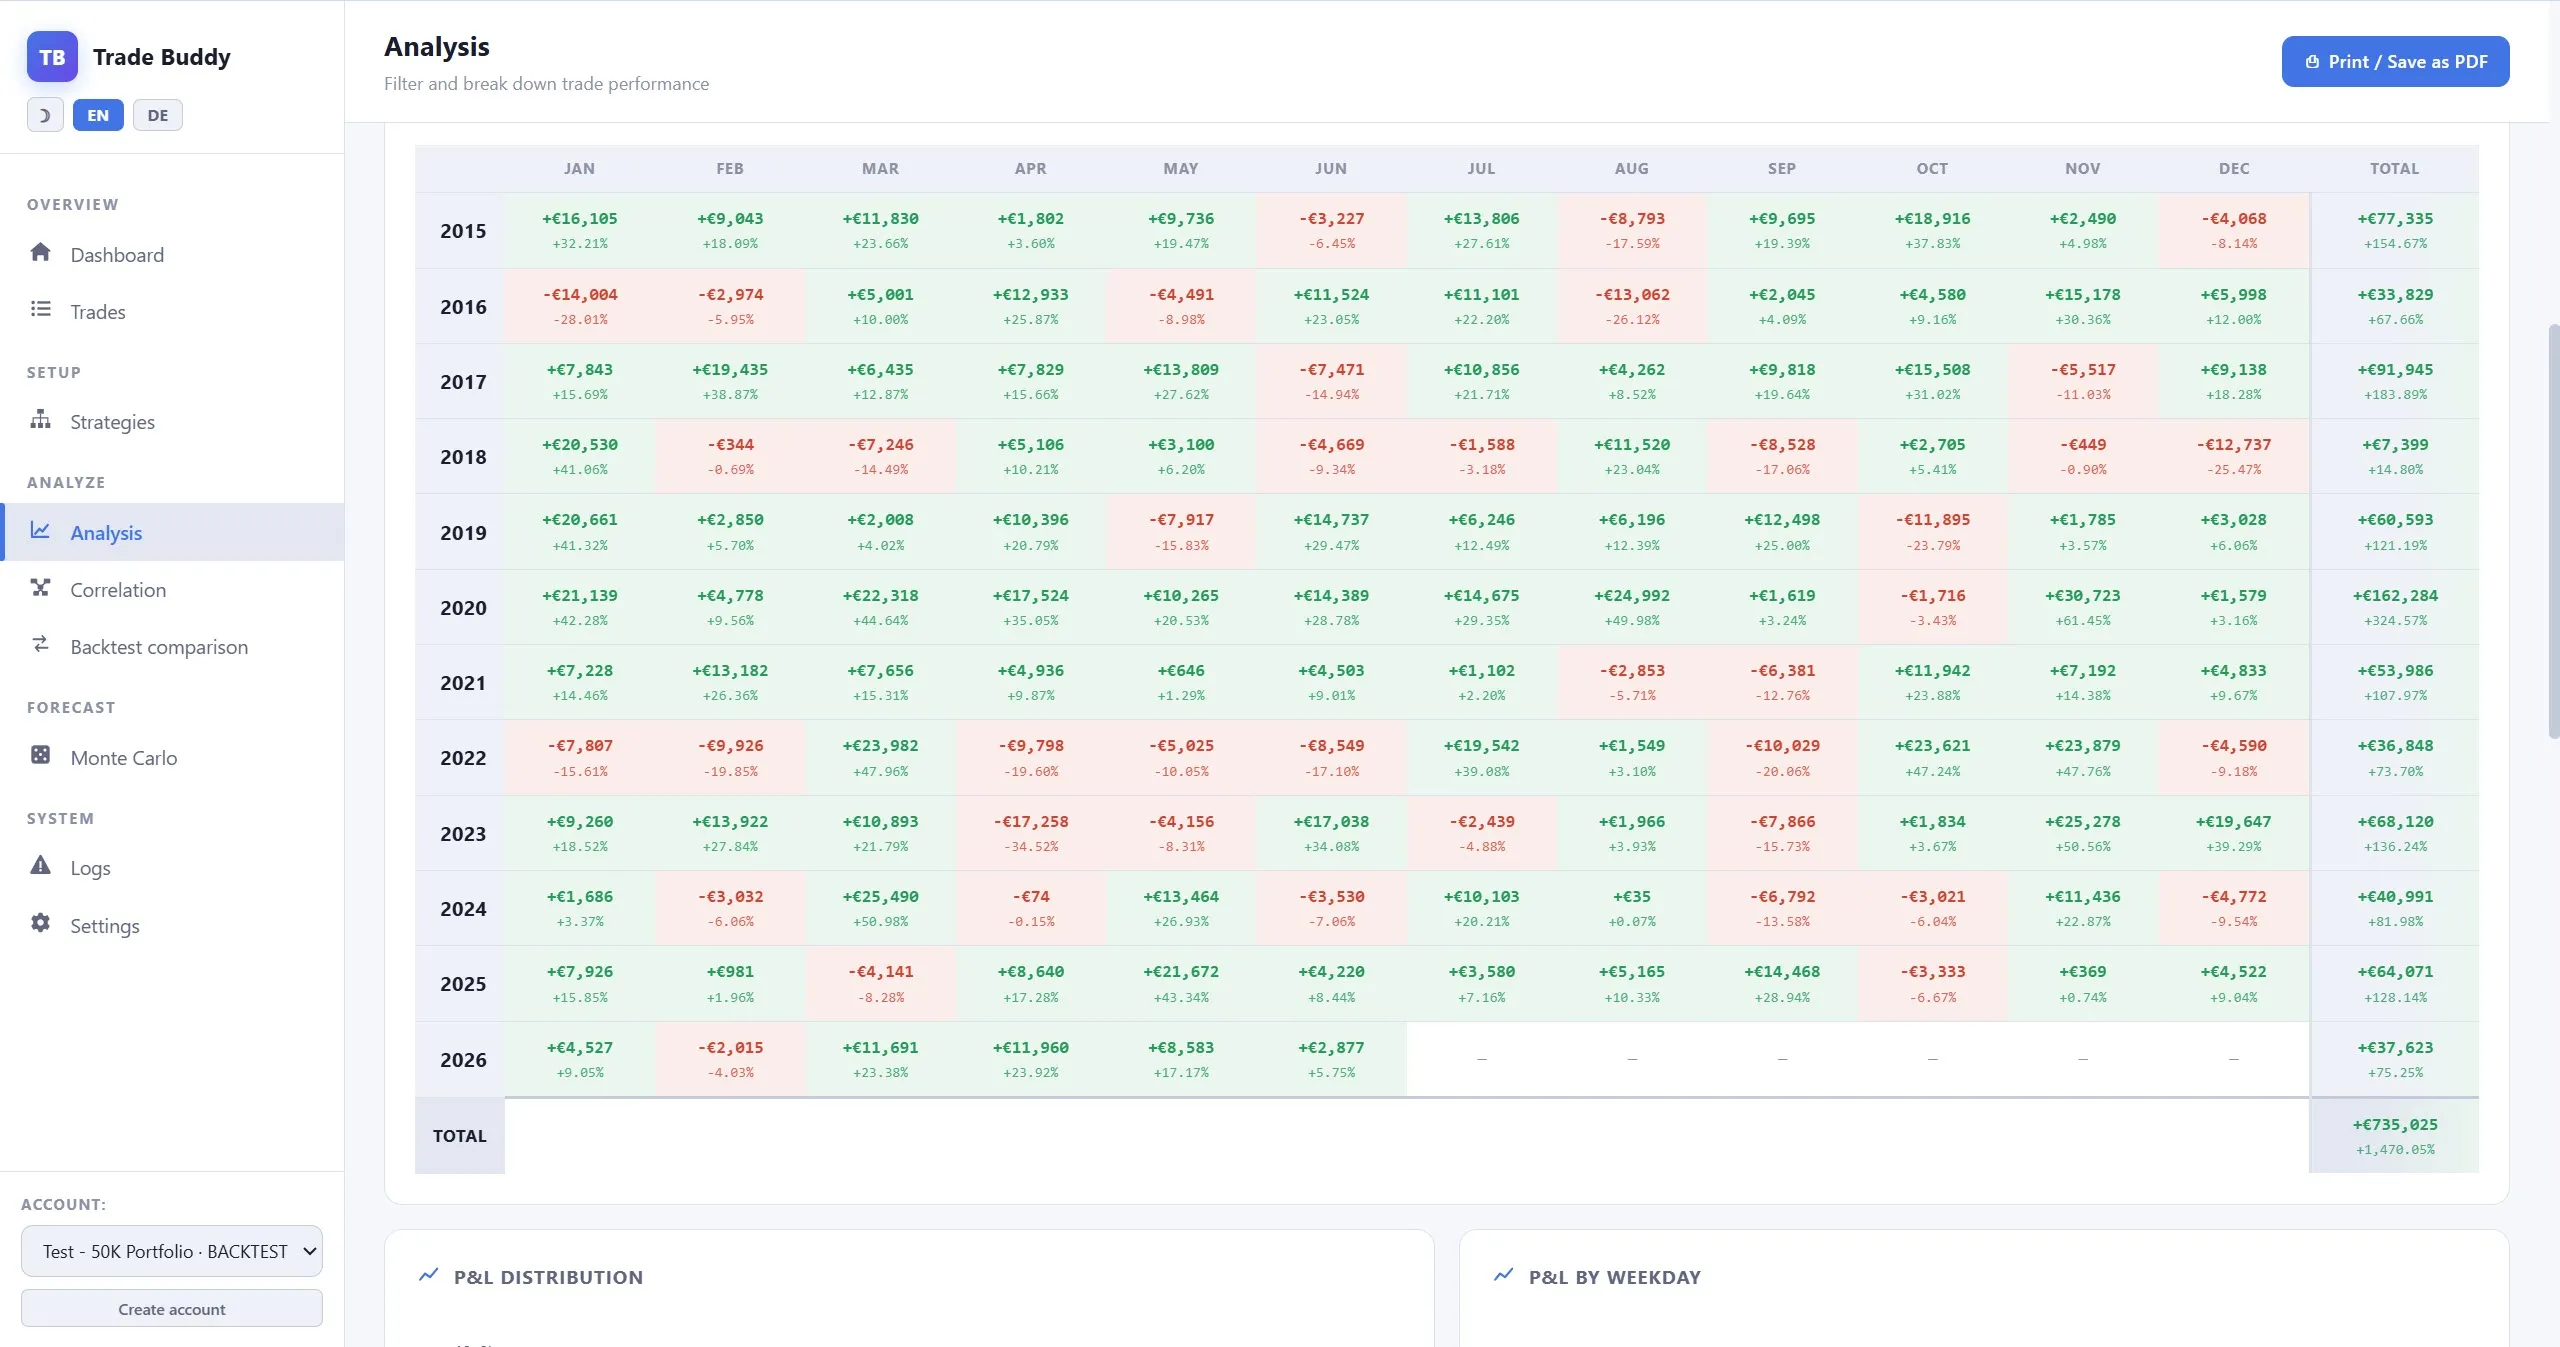
And the part it’s tempting to oversell: in the test, every single calendar year was profitable — from about €7,000 in the weakest year to over €162,000 in the strongest, for a total of +€735,025 since 2015. That’s the past. The future will contain losing years. I’m not promising anything; I’m showing you the picture so you can form your own informed opinion.
Backtest vs. reality — the live comparison
This is the step most “backtest” videos skip. I’ve traded this account live since end of March 2024 — roughly two years — for about €88,000 in verified profit. It’s Myfxbook-verified, and I’ve streamed almost every single trade live on my channel. Nobody can credibly call it fake.
So how close is the backtest to reality? Overlaid on the same two-year window, the direction is clearly similar — the backtest made about €119,600 versus €88,500 live, so the test ran roughly a third higher. I’m not going to pretend that gap doesn’t exist. Here’s why it’s there:
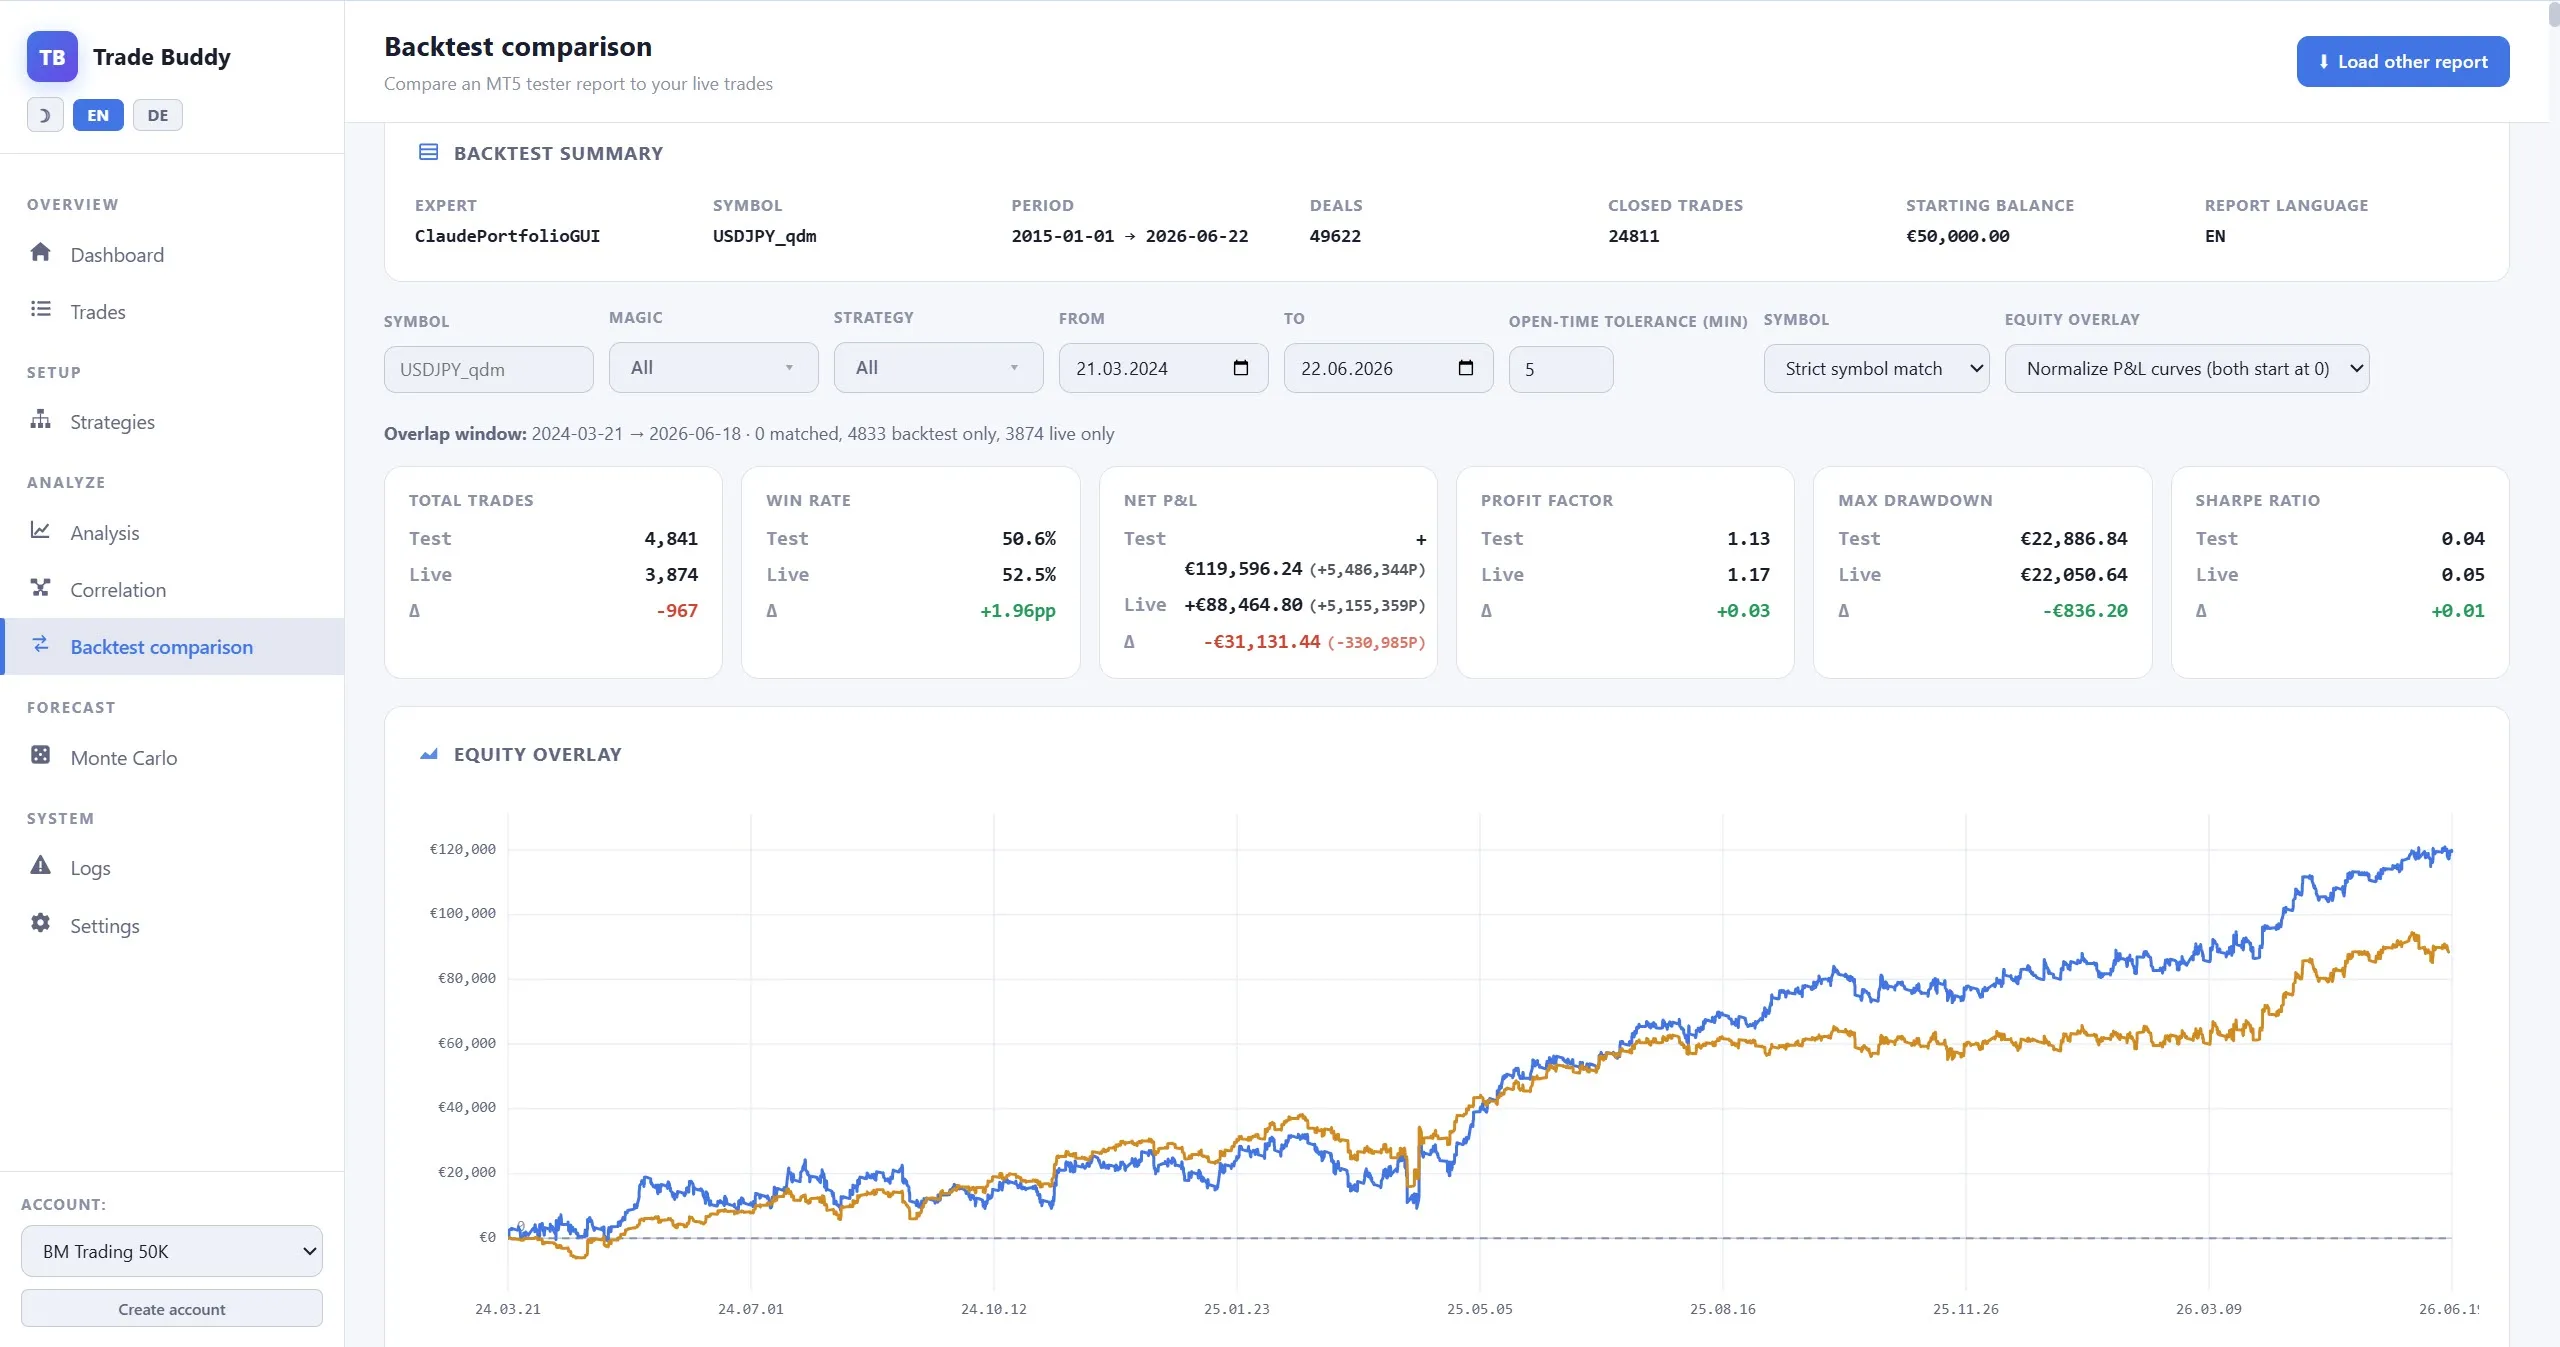
Over the two years I changed my signals several times. I used to trade EURUSD and dropped it. I had range filters on the currency pairs early on. Go Long was restricted to new-daily-highs-only at the start. And I only added ATR Candle Breakout on gold a few months ago. So the early live period diverges from the test by design — while 2025–2026 line up much more closely, because by then my live settings more closely matched the tested ones.
One detail I find reassuring: over that same window, the maximum drawdowns were almost identical — about €22,900 in the test versus €22,100 live. Both are strongly profitable; the live result is a bit lower. That’s the honest version.
The honest part — drawdowns
This is the most important section, so don’t skip it.
The biggest drawdown in the full 10-year backtest was around €45,000 (back in 2016), with other dips around €30,000. The biggest drawdown I’ve actually lived through in the real account so far is about €22,000.
Read that again: the real drawdowns I’ve personally experienced are smaller than what history says is possible. Anyone trading automated systems has to plan for drawdowns of that size — or larger. This is exactly why I run long-term backtests, and why I think every automated trader should: they show you the rough years, not just the smooth ones. There is no holy grail here.
Want to analyse a backtest like this yourself?
The per-strategy and per-market breakdowns, and the live-vs-backtest overlay you’ve seen above, are all done in Trade Buddy — my free, browser-based analysis tool. No signup, no registration, nothing to install.
New feature: it now imports MT5 backtest HTML reports. So you can take one or more tests, break them down by symbol and strategy, and overlay them on your real account to see how realistic it actually is — exactly what I did in the video.
👉 Try it with my real data: download the exact backtest report from this article and load it straight into Trade Buddy on your own PC. Filter by strategy and symbol, inspect the drawdowns, run the comparison. (Heads-up: it’s a large file, ~55 MB, because it contains 10 years of trades.)
The takeaway
This is what I think realistic trading looks like: a handful of simple strategies, spread across a diversified portfolio, with verified results and honest drawdowns — not cherry-picked screenshots. The long-term test makes me genuinely optimistic. But my live account hasn’t yet seen the big drawdowns that history says are coming, and I’d rather you hear that from me now than learn it the hard way.
Run the same strategies — all free
All four EAs are free to download. Test them as long as you want in the MT5 Strategy Tester, then decide if you want to take them live.
To run them live, open an account with one of my partner brokers and submit your MT5 account number through the license form. That’s my business model — and it costs you nothing extra.
One last reminder: past performance — backtested or live — is not a promise of future results. Trading leveraged products carries substantial risk, and you can lose money. Backtest, size conservatively, and only risk what you can afford to lose.
Risk note: nothing in this post is investment advice. Trading forex and CFDs carries significant risk. Past performance is no guarantee of future results.