My Biggest USDJPY Trade Ever: +€6,251 From a Single Breakout
My biggest-ever USDJPY trade: +€6,251 from one Range Breakout short. Why a tiny range meant a huge position — and why I never cut a winner like this short.
By René Balke
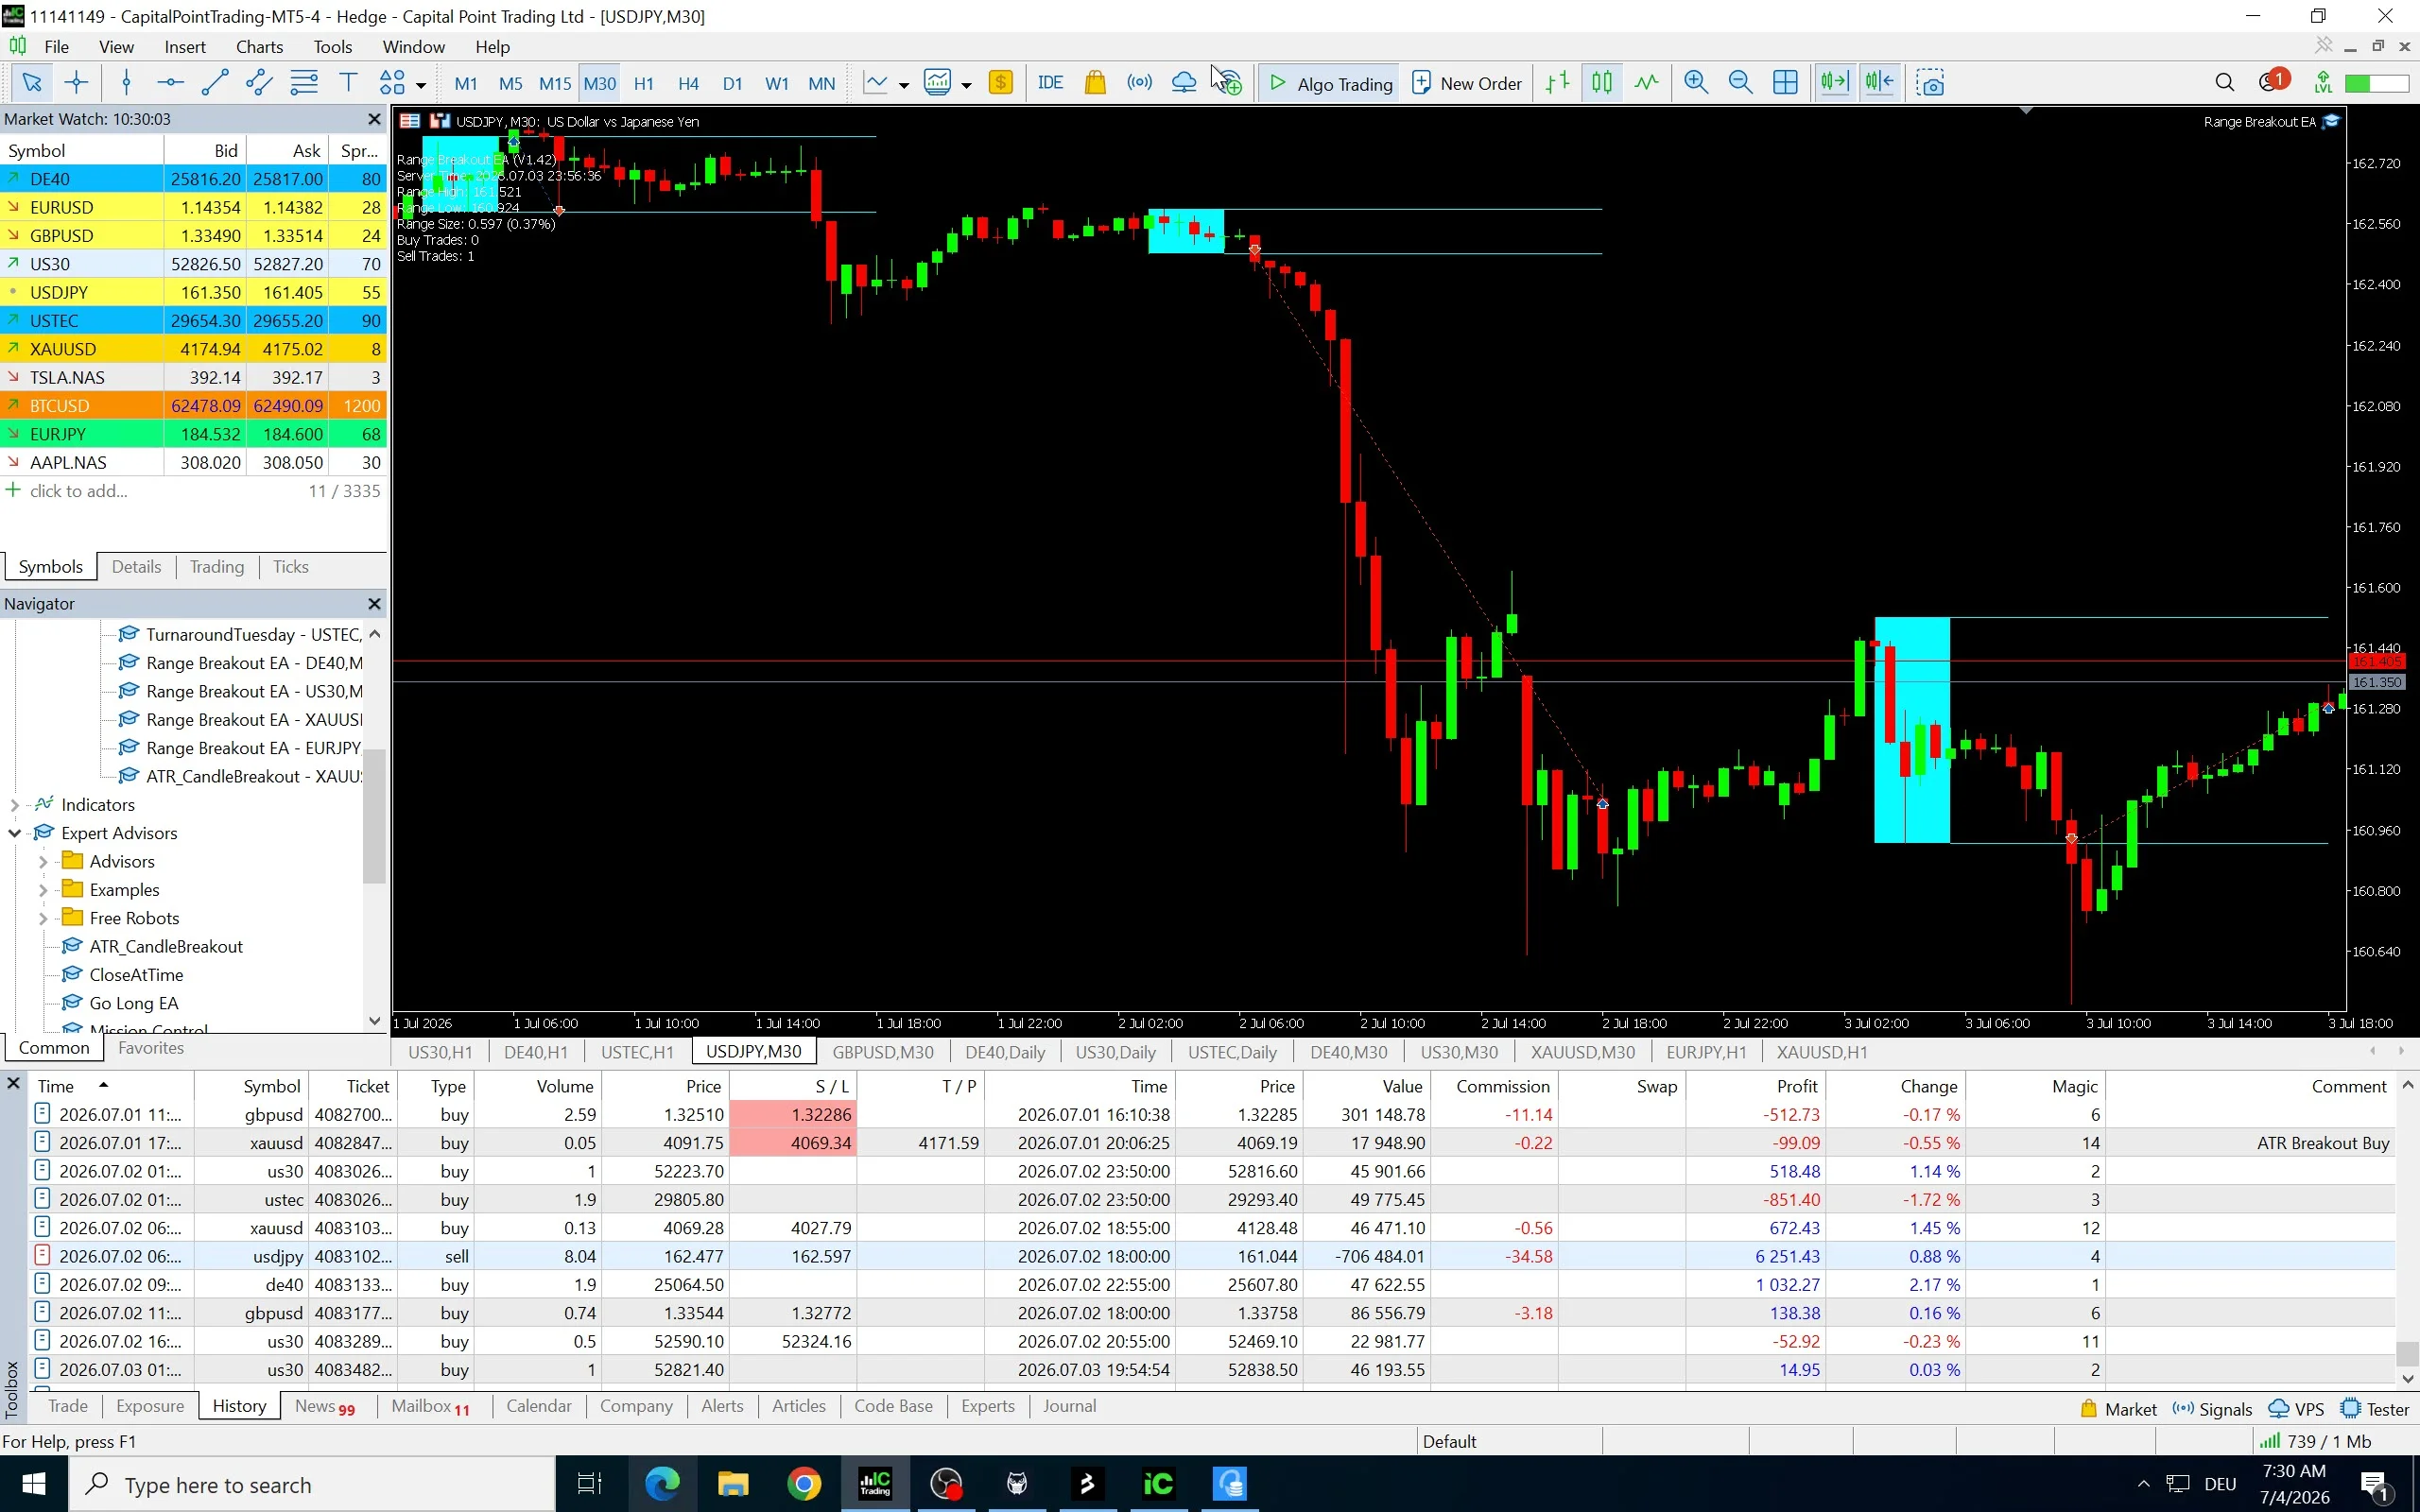
On 2 July, my account had its best single trade ever on USDJPY: +€6,251 from one position. The whole day added more than €7,000 — over 10% of the 50K account in a single session.
The irony isn’t lost on me. USDJPY has been the worst performer in my account all year — I wrote about that exact pain in the June update. And then the same pair, running the same strategy — the Range Breakout EA — handed me my biggest win to date. Here’s exactly what happened, why the position was so large, and why I didn’t touch it.
The trade
It was a textbook Range Breakout short. On the morning of 2 July the EA marked out its range — and it was tiny, under 0.10%, about 12 pips from high to low. Price broke the low, so the EA went short at 162.477, with its stop on the other side of the range at 162.597. From there USDJPY fell all day and the trade closed near the session low at 161.044 — a 143-pip move. Net result: +€6,251.43, on about €500 of risk.
Why the position was 8.04 lots
This is the part worth understanding, because it’s the whole engine behind a day like this.
Every trade this EA takes risks a fixed 1% of the account — about €500 — with the stop loss sitting on the opposite side of the range. That single rule has a powerful consequence: the smaller the range, the bigger the position. When the stop is only ~12 pips away, you need a large lot size — here, 8.04 lots — to put exactly €500 at risk. When the range is wide, that same €500 buys a much smaller position.
So the risk is always the same; the size is not. And that cuts both ways:
- On a bad day, a tiny range means a big position and a fast stop-out. These are the days that hurt.
- On a day like this one, that same big position turns a normal-looking move into an outsized win — more than 12× the €500 at risk.
This trade was the good side of that trade-off, in full.
Why I didn’t touch it
At its best, the trade was showing even more profit than it finally closed with. It pulled back slightly and the EA closed it near the day’s low at its set time — which, for a short, is almost the perfect outcome.
Here’s the key: this strategy has no fixed take-profit. It’s built to let a runner run and exit on its own rules. If I had “helped” — closed it manually at +€3,000, or slapped a trailing stop on it — I would have cut the winner off on exactly the day it mattered most.
That’s the whole reason I don’t intervene and don’t use trailing stops on this strategy. The big days are rare, and a huge chunk of the long-term edge lives inside them. Clip them, and you quietly destroy the strategy.
What one trade did to the drawdown
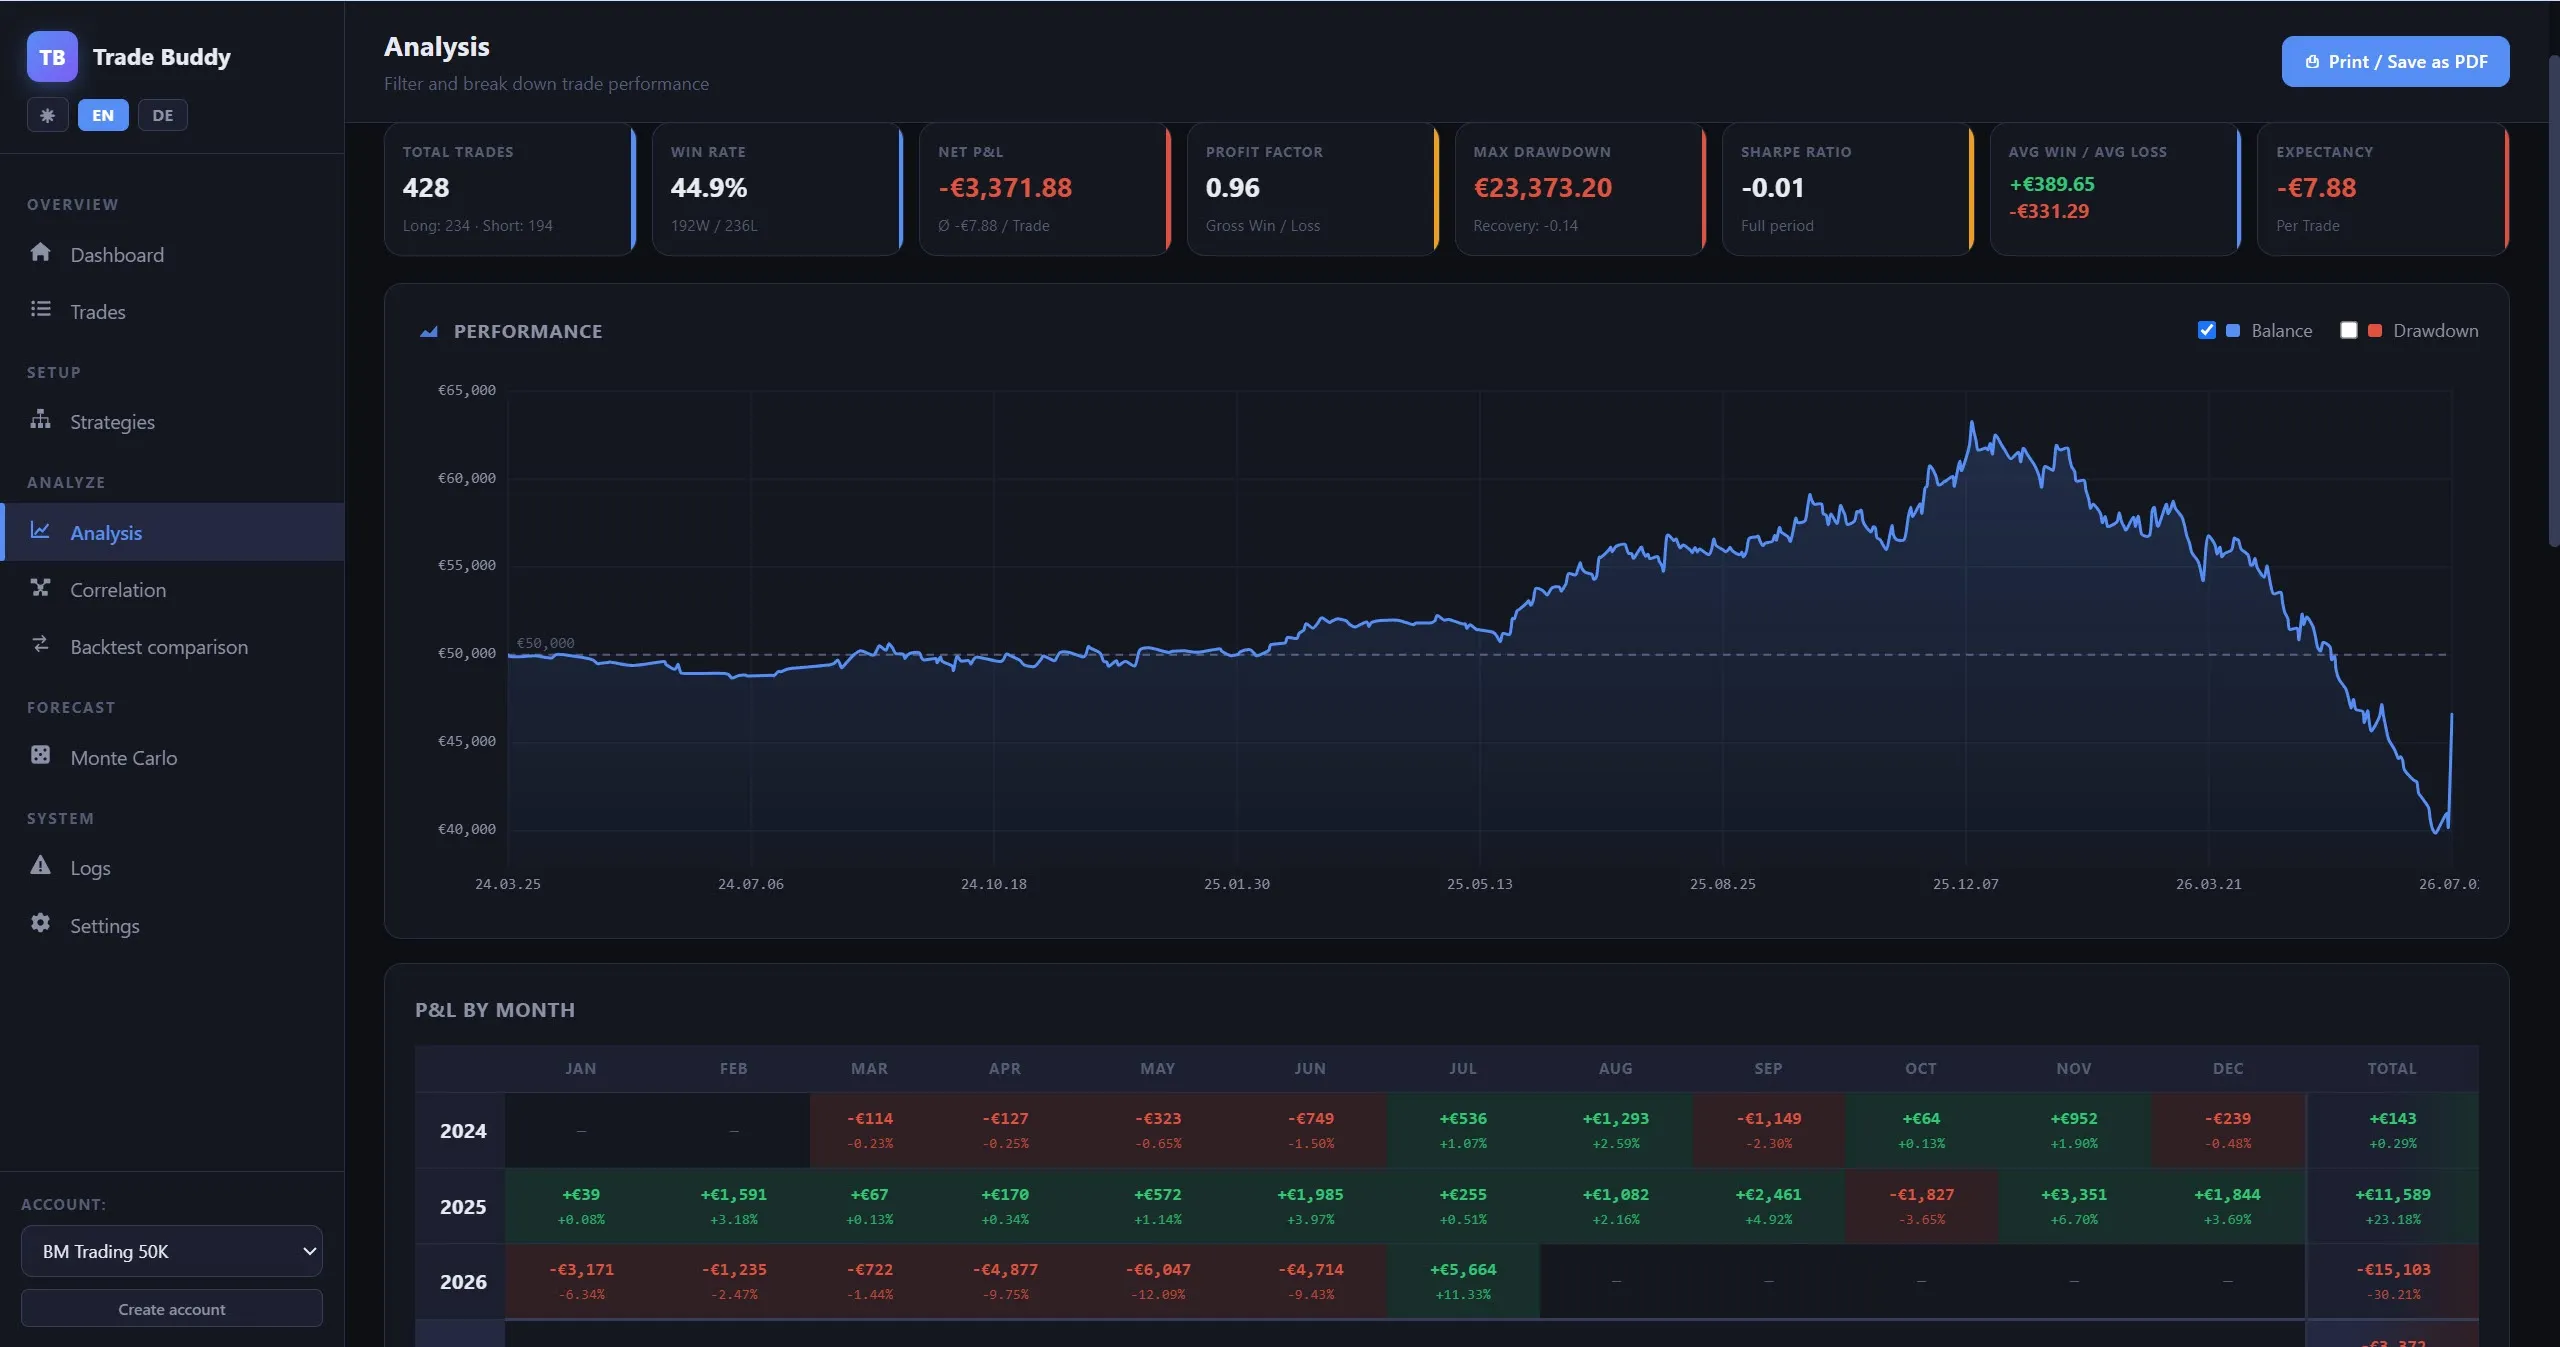
USDJPY has been my problem child. On the live account it’s still net −€3,372 since March 2024, and it recently hit its worst drawdown ever — about €23,373 from the peak. You can see the damage on the live equity curve below: a long, brutal 2026 slide.
Now look at the very end — that spike is this one trade. A single position clawed back more than 25% of the six-month drawdown in one day. That kind of recovery is only possible because the trade had no ceiling on it. One more reason not to cap these with a take-profit or a trailing stop.
Was it luck?
Honestly? On a single day — yes, absolutely. I can’t tell you which day will produce a 12× winner, and anyone who claims they can is selling something.
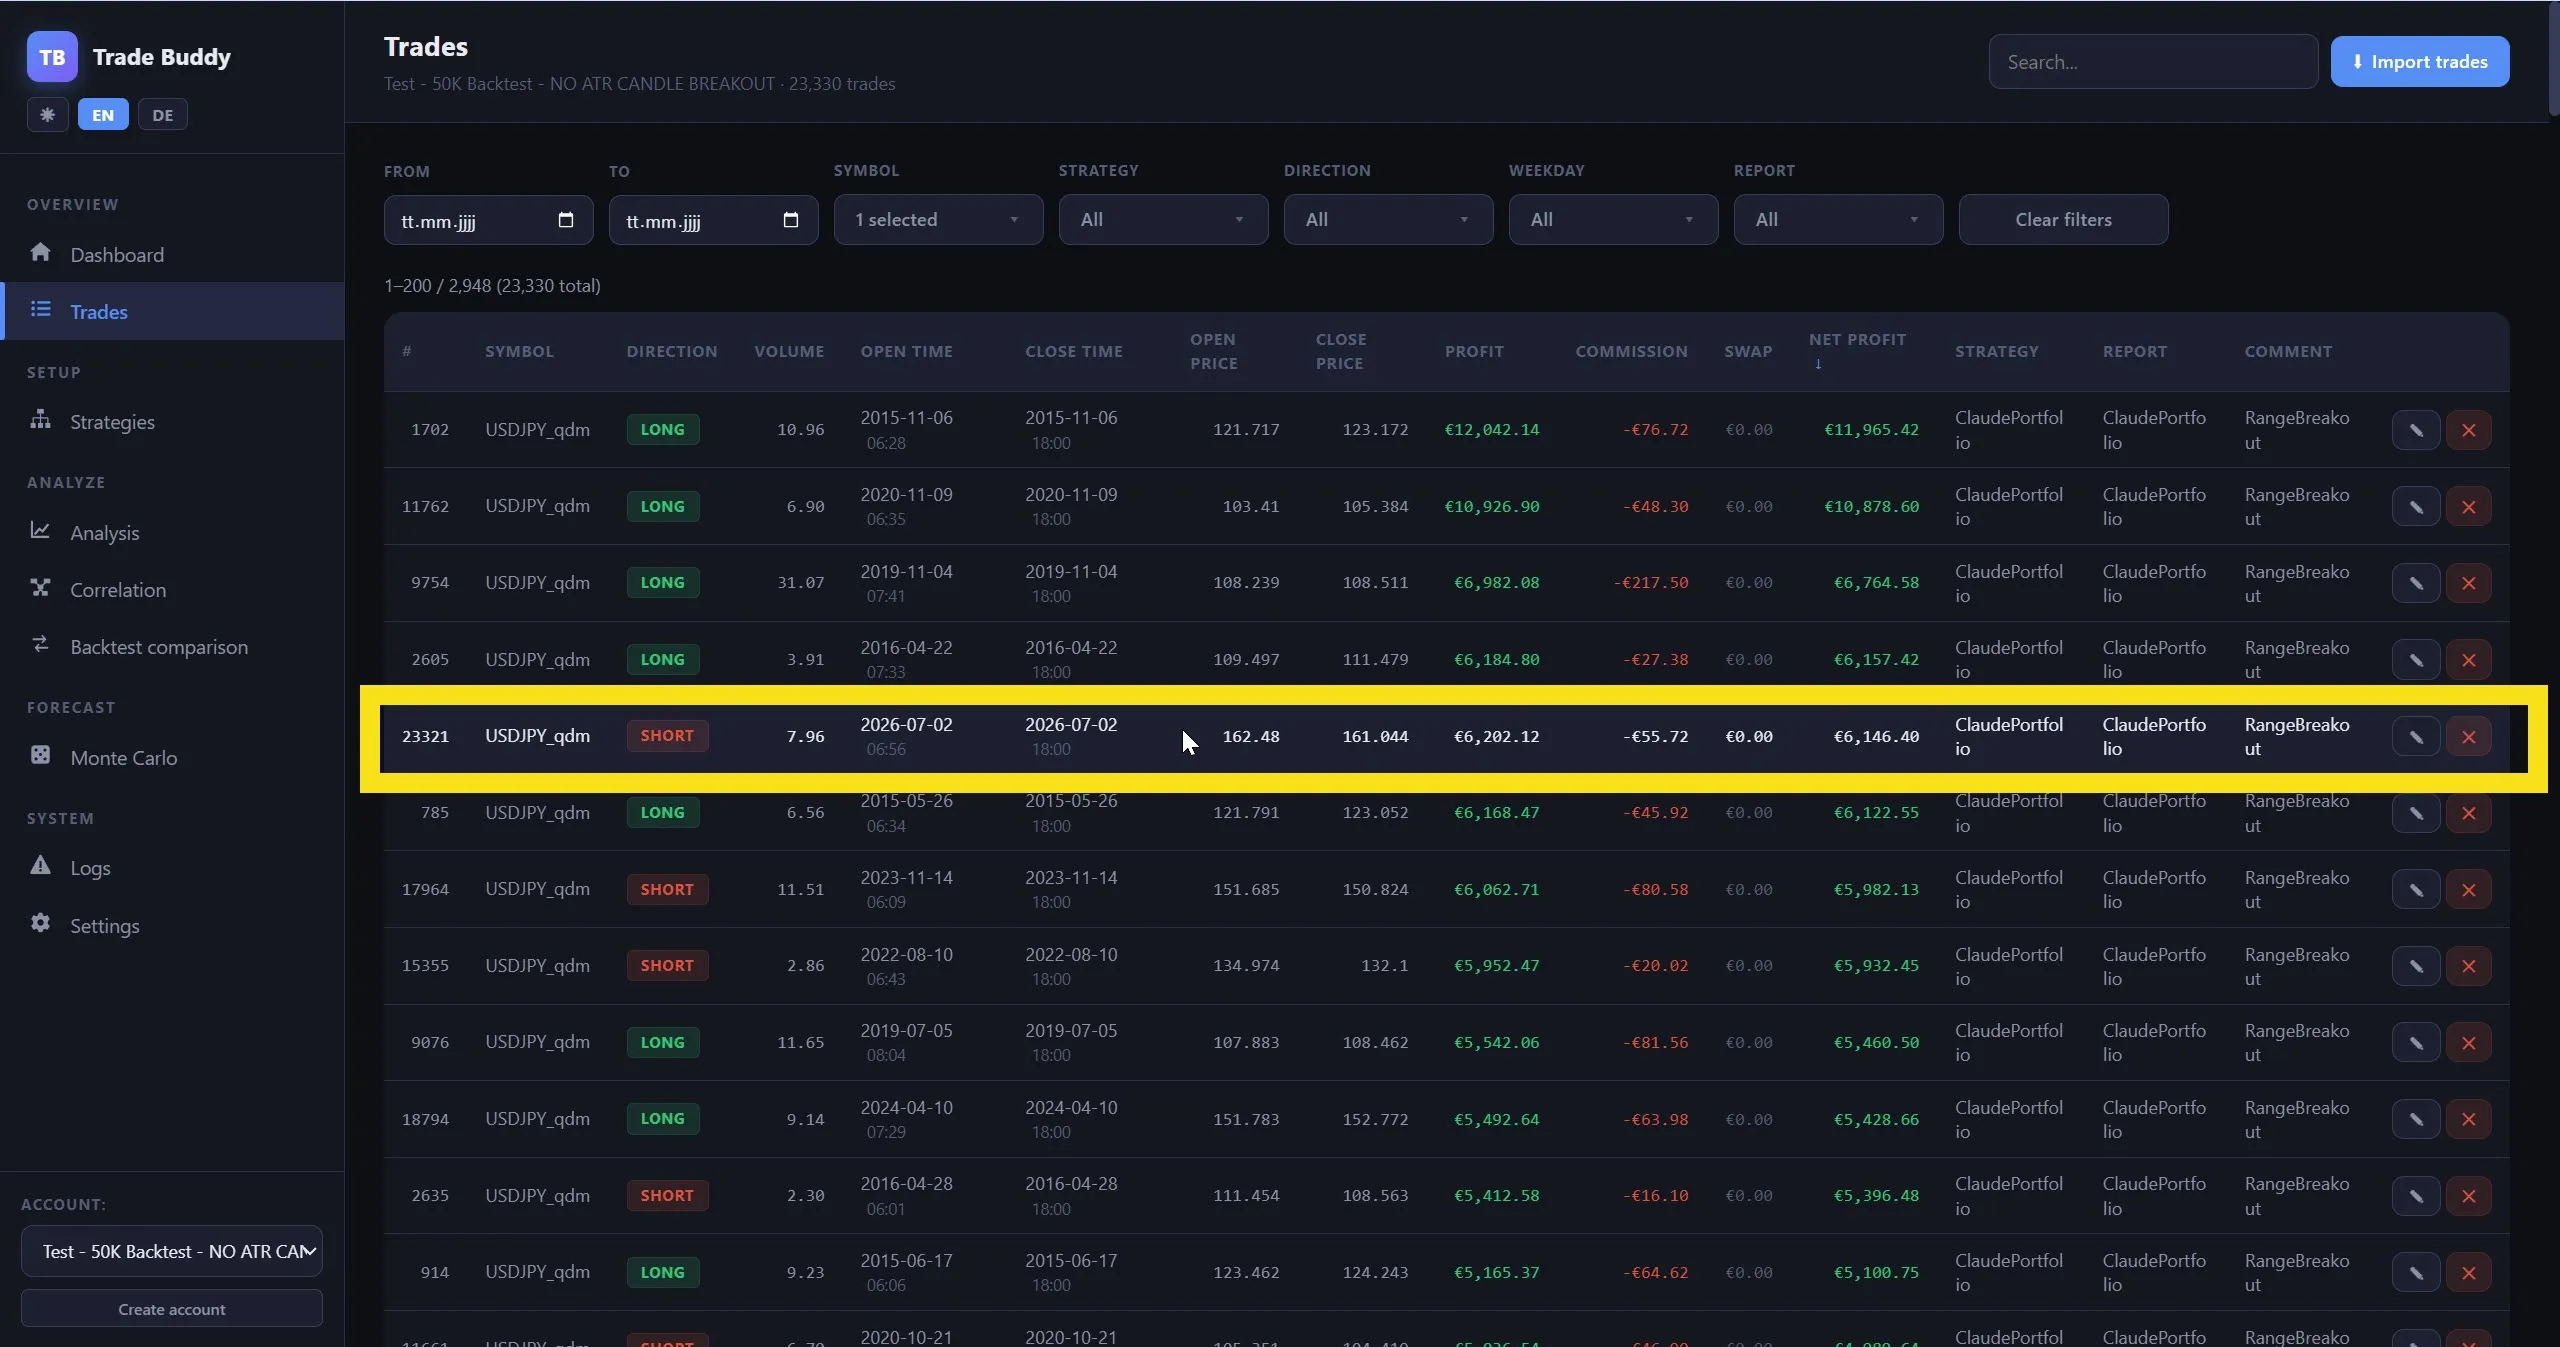
Over the long run, though — no, not really. These outsized wins are a recurring feature of this strategy, not a fluke. My 10-year backtest of the exact same USDJPY Range Breakout is full of them. In fact, that backtest produced almost the identical trade on the very same day: a USDJPY short closing at 161.044 for about €6,200, versus €6,251 live. That’s live execution matching the model to within about €50.
And it isn’t even the biggest. Ranked by size, you can even see bigger winners in there, like +€12,042 (2015) and +€10,927 (2020). Rare — but they show up.
The long-term picture
This is the part that keeps me calm through the current drawdown. Over ten years, this exact USDJPY Range Breakout is strongly profitable in the backtest: +€162,354 net, profit factor 1.16, grinding steadily higher.
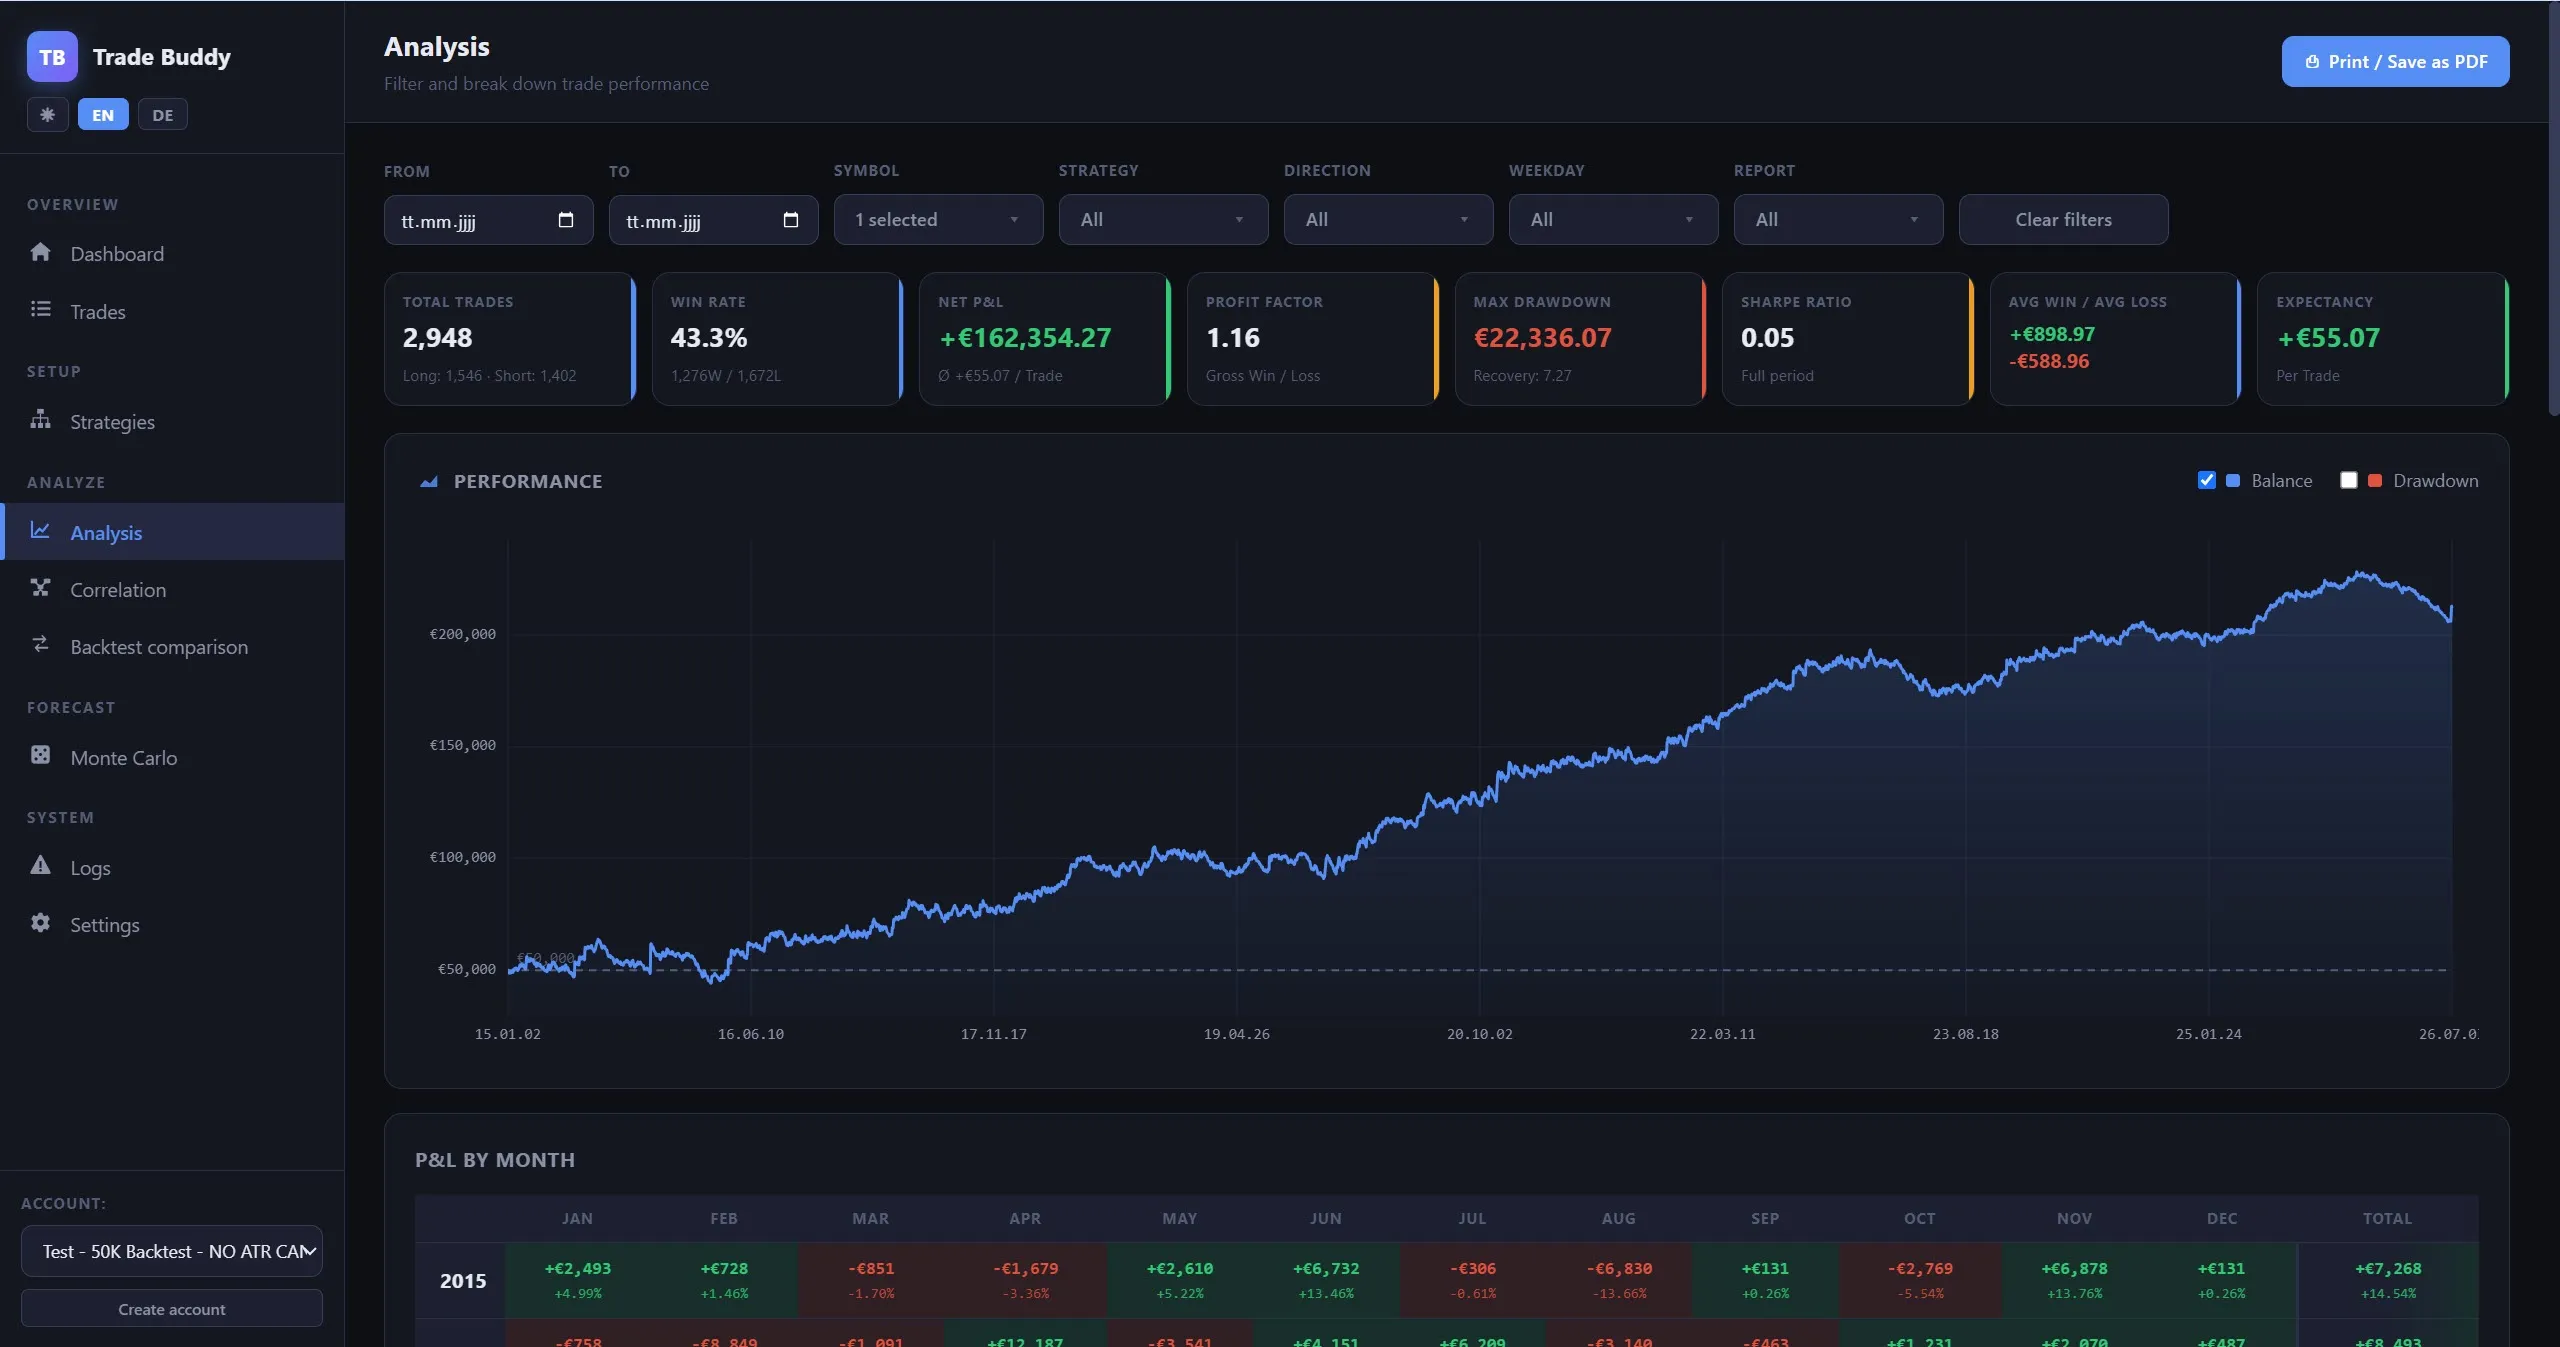
But that same test is also full of deep, recurring drawdowns — regularly €15,000, occasionally north of €22,000. The worst backtest drawdown (€22,336) is almost exactly the one I’m living through live right now (€23,373). In other words: the pain I’m in is, unfortunately, normal for this strategy. It isn’t broken — it’s doing exactly what a decade of data says it does.
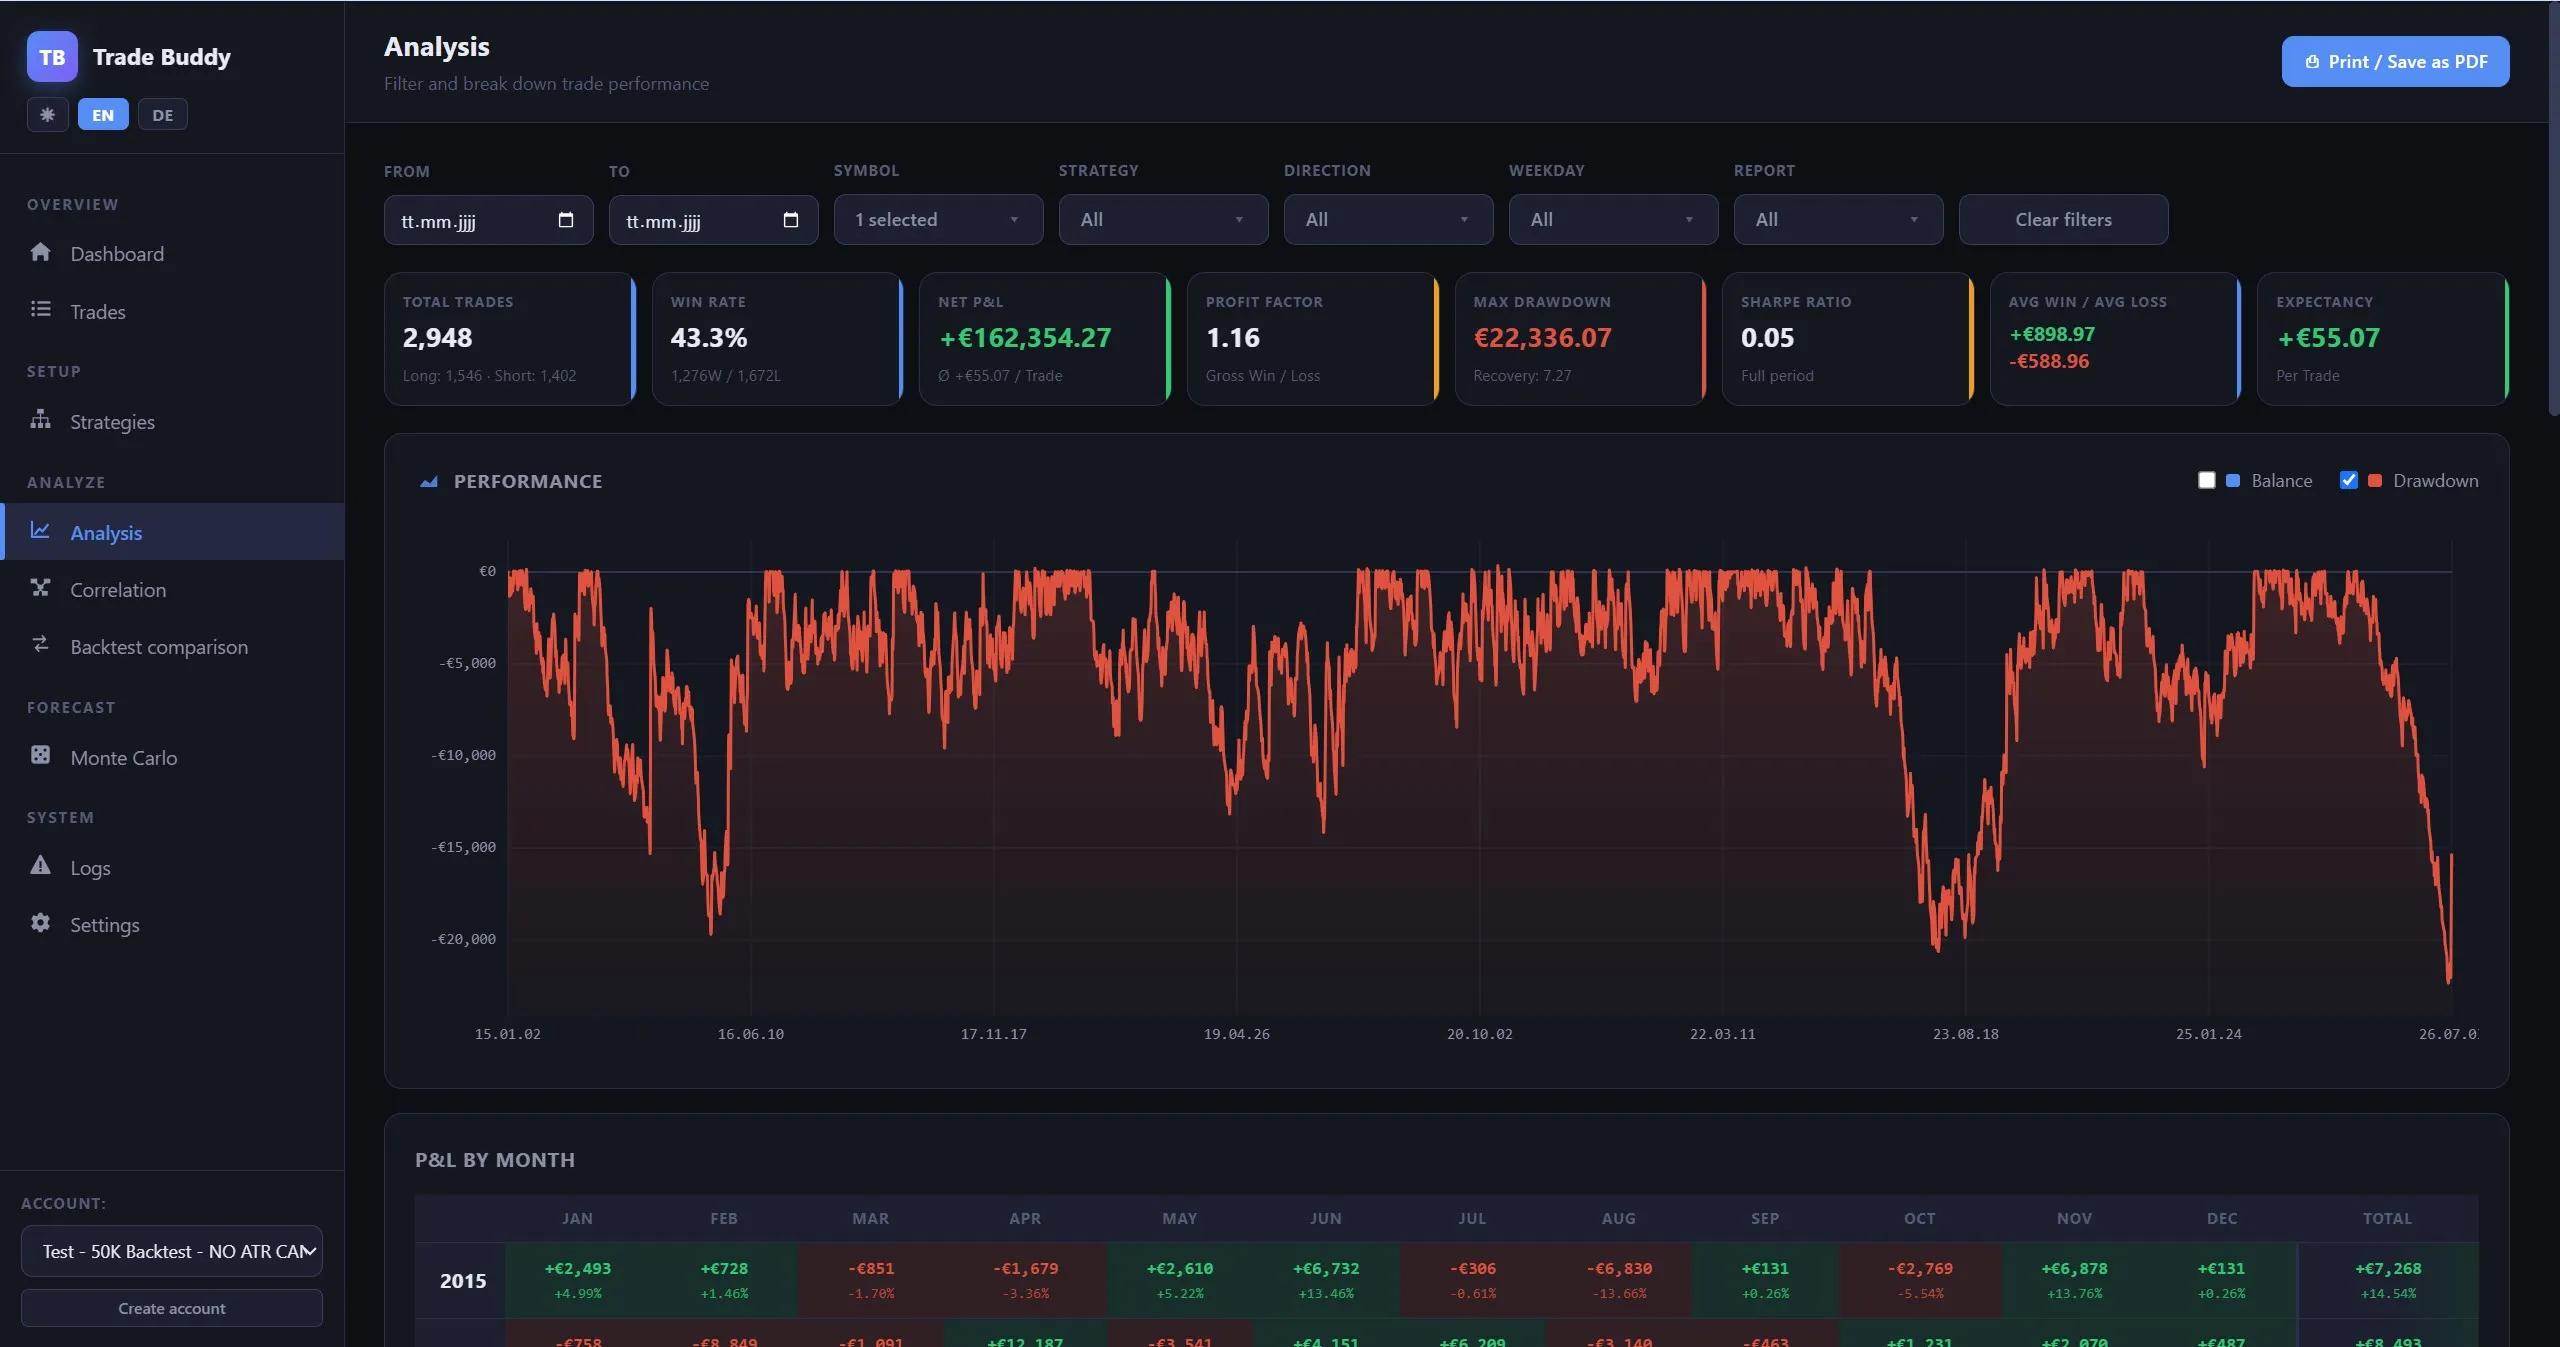
That’s the real power of automated trading. Not prediction — discipline plus statistics. You study what a strategy actually does over thousands of trades, then you run the exact same rules every single day, with perfect, emotion-free execution. You show up for the boring days and the ugly drawdowns, so that you’re in position on the rare day the market hands you a 12× winner. A human would have talked themselves out of it. The bot just executed.
Run the same strategy — free
This was the Range Breakout EA — the same free tool I trade live, on the same settings.
Download it, load it into the MT5 Strategy Tester, and study its ranges, its drawdowns and — yes — its big days for as long as you like. No signup. Every breakdown in this post was done in Trade Buddy, my free browser-based analysis tool.
To run it live, open an account with one of my partner brokers — ideally a low-commission one — and submit your MT5 account number through the license form. That’s my business model, and it costs you nothing extra.
Past performance — backtested or live — is not a promise of future results. That €6,251 was one good day; the six red months before it were just as real. Trading leveraged products carries substantial risk, and you can lose money. Size conservatively, and only risk what you can afford to lose.
Risk note: nothing in this post is investment advice. Trading forex and CFDs carries significant risk. Past performance is no guarantee of future results.